Current Conditions in the Lower Deschutes are Far From "Natural"
The Pelton-Round Butte Dam Project Operators frequently say that operation of the selective water withdrawal (SWW) tower has created more “natural” conditions in the lower Deschutes River. As covered in last week’s temperature standard violation post, when looking at the pre-Project conditions during the 1950s (before the 3-dam Pelton-Round Butte complex was completed), it is apparent anthropogenic effects impacted water quality on the river during that time period. We argue that those conditions are incorrect to target. Ironically, this is exactly what the Project operators have done in their primarily temperature-focused water quality management program.
This week’s post expounds upon how the existing water quality data does not support the contention that water quality conditions are more “natural” in the lower Deschutes following SWW Tower operations. On the contrary, overall water quality declines following Tower operations show that the current state of the lower Deschutes River is in need of much improvement in order to meet water quality standards and heal the lower Deschutes. Fortunately, this can simply come from increasing more cool, clean bottom water from the SWW Tower at the correct time of year.
Temperature
Increasing water temperatures in the river for the majority of the year with only minor cooling for a short period in the fall is not a natural condition nor healthy for the lower Deschutes River. The graph below depicts the difference in lower Deschutes River temperatures at the USGS Madras Gauge just downstream of Lake Billy Chinook between (1) all year’s post-tower operations 2009-2022 and (2) the available temperature data at the same site pre-Tower operations from the 1970s to 2009. The temperature difference is displayed by calendar day, which means positive values depicted in red indicate dates during the year that are now warmer in the lower Deschutes following SWW Tower operations, whereas negative values depicted in blue indicate dates during the year when the river is now cooler. The larger the value, the warmer or colder the river temperatures are following tower operations.
As shown by the graph, it is clear that even though the river is mildly cooler (~0.5C) in the late summer through fall, this cooling is relatively small compared to the warming during the rest of the year (over 2.5C warmer in May). One of the main justifications cited by Project Operators for this temperature modification is that they must save cold water to release into the lower Deschutes River in the fall. This graph shows that the amount of cooling in the fall is very small in comparison to the warming that occurring the rest of the year.
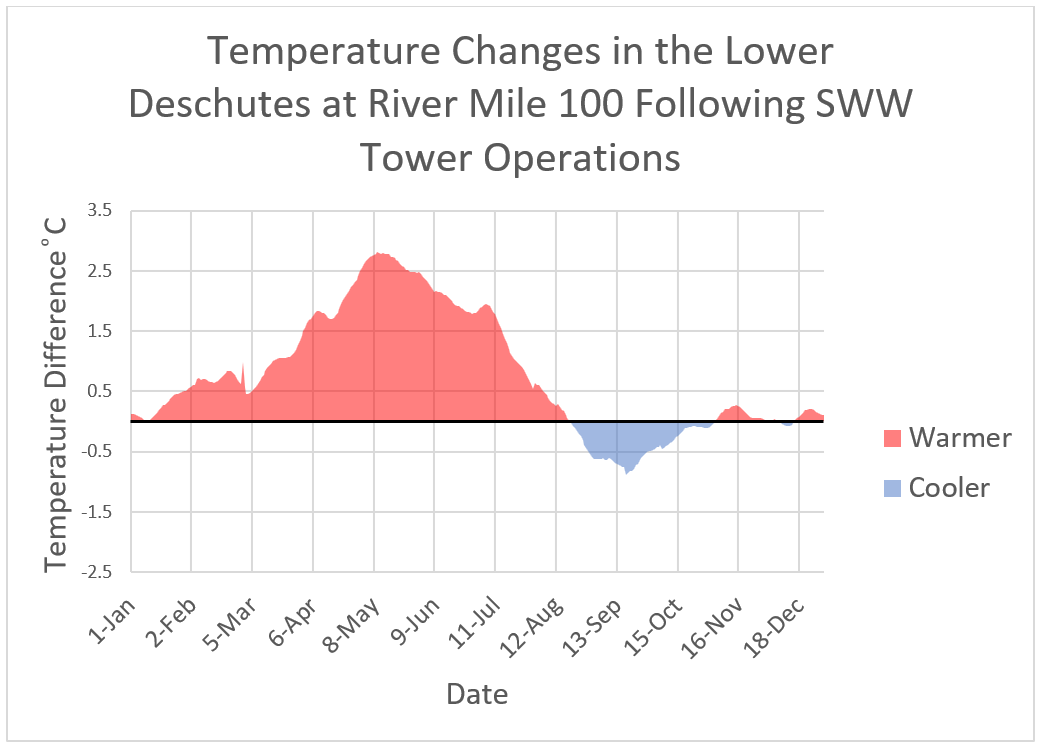
Graphed values depict difference between (1) the average 7DADM (7-day average daily maximum) temperature calculated from 13 years during tower operations (12/02/09 to 12/31/22) and (2) the average 7DADM of lower during 21 years before Tower operations (10/01/1971 – 09/30/1988, 11/04/2005 – 12/01/2009) at RM 100 just downstream of the Reregulation Dam tailrace. Data source: USGS (monitoring location 14092500).
Furthermore, water temperature historically decreased naturally around mid-August pre-SWW Tower (see graph below) and there is no data-based biological benefit that supports the intentional temperature shift (see our recent “cold water” post). Overall, the available data indicates that many biological and environmental conditions have declined following the SWW Tower and current temperature management.
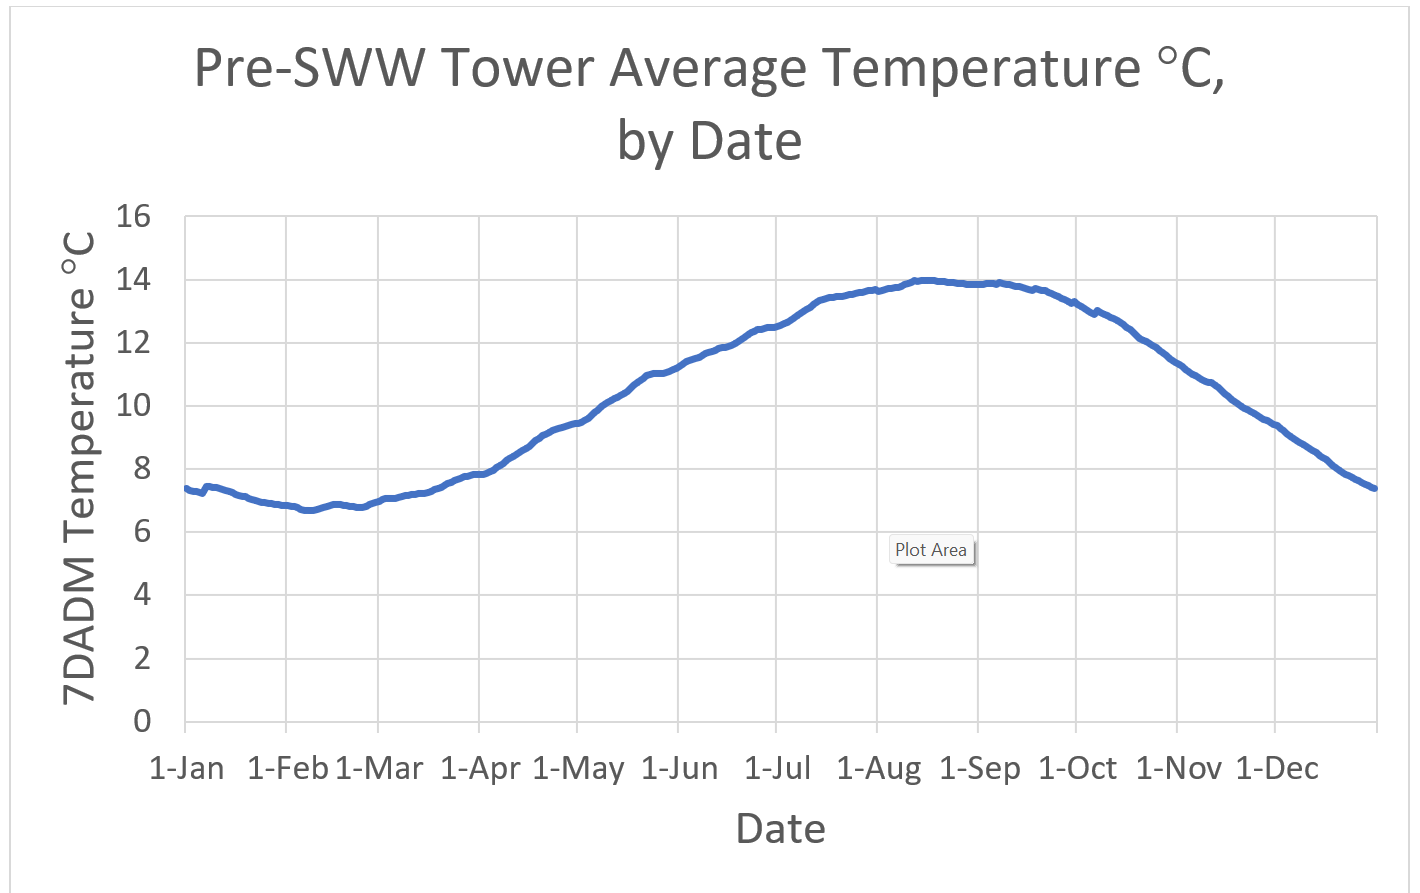
Average 7-day average daily maximum (7DADM) by calendar date for all available temperature data at the USGS Madras gage prior to SWW Tower operations: 1952-1958, 1971-1988, 2006-2009. Data source: USGS (monitoring location 14092500). On average, prior to SWW Tower temperatures peaked early August and subsequently declined.
pH
Since the DRA started continuous water quality monitoring in 2016, which has typically occurred March-November, most monitoring days have been in violation of the maximum standard of 8.5 set by ODEQ to protect aquatic life - see bar graph below. Most pH violations have occurred from April through October. As previously discussed in our pH post, the number of pH violations has increased drastically following SWW Tower operations relative to pre-Tower conditions according to long-term pH data from DEQ’s Ambient Water Quality Monitoring System.
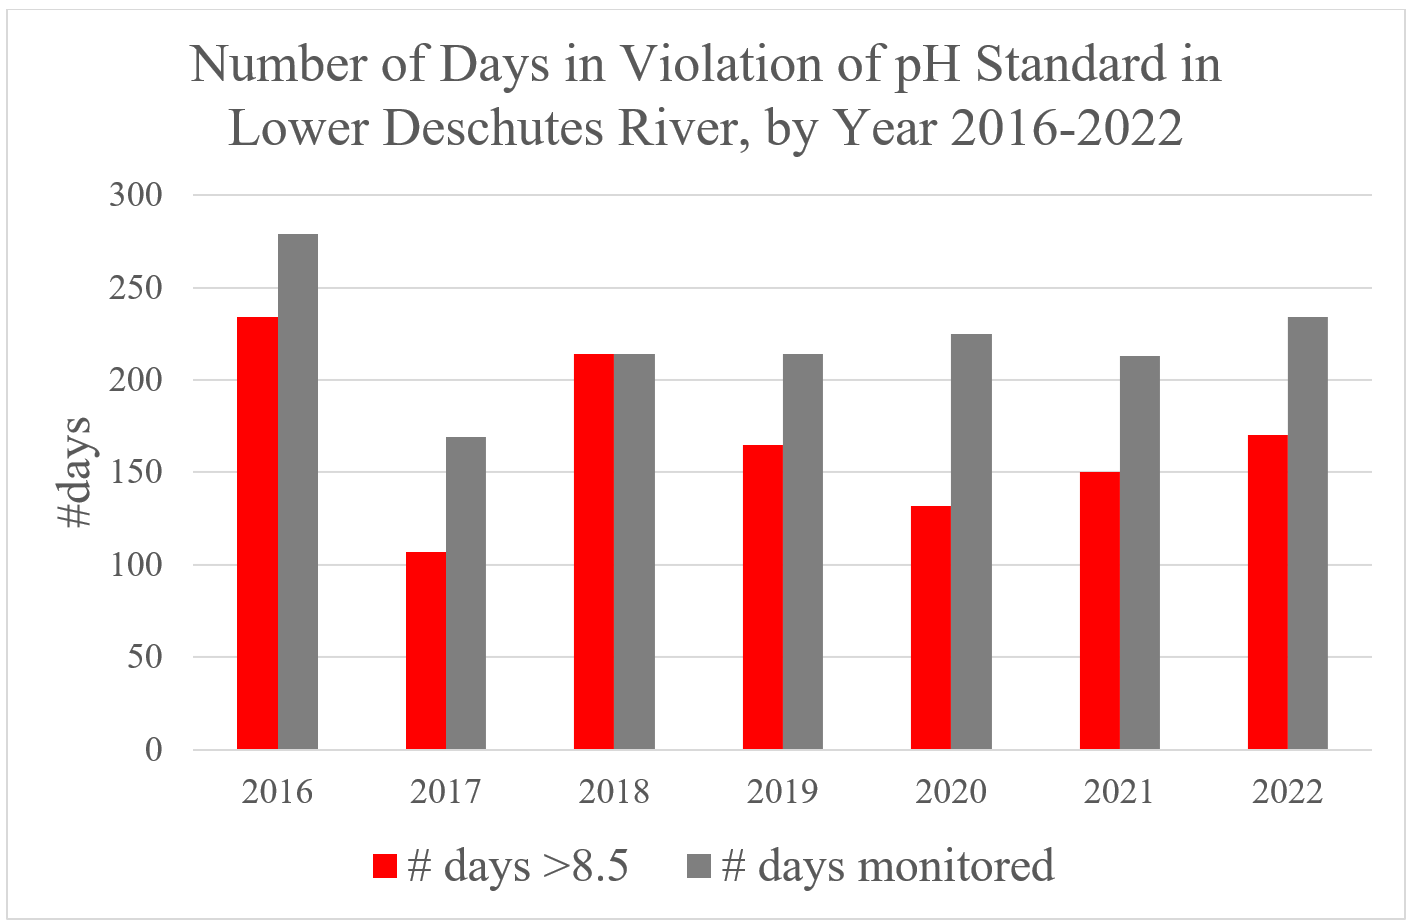
Number of days in violation of the 8.5 pH standard (red bars) and total number of days monitored (grey bars) by year for all continuous pH monitoring data collected by the DRA.
Furthermore, many of the daily maximum pH values are not only above the Oregon Department of Environmental Quality maximum standard of 8.5, but approach 9.0 - see two graphs below from our 2023 pH data at our two monitoring stations near Warm Springs and in Maupin. pH levels higher than 8.5 SU increase the toxicity of pollutants such as ammonia and heavy metals (EPA 2023a), pH levels of 9.0 or above are likely to harm salmonids, and any prolonged level above 9.5 is lethal to salmonids (Alabaster & Loyd 1982). While a level of 9.5 has not been observed by the DRA, daily maximum values regularly exceeding 9.0 is cause for concern. Obviously, current pH conditions are not “natural” or indicative of healthy river conditions. As detailed by the DRA in in our nutrients post, we believe these pH violations are the direct result of nutrient-laden surface spill into the lower Deschutes.
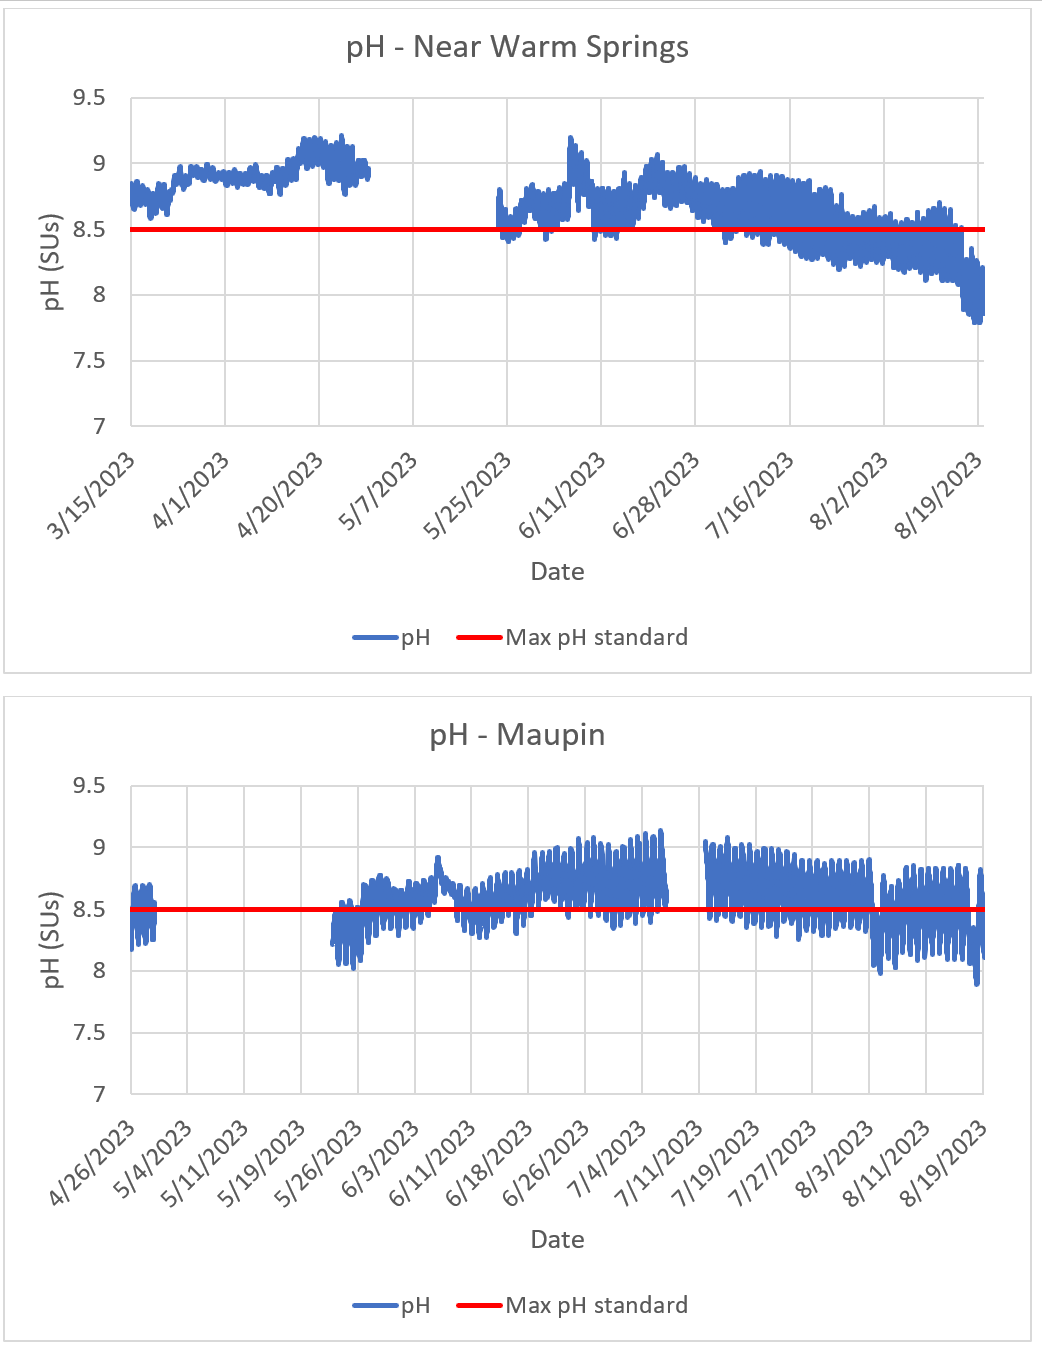
pH readings from the DRA Warm Springs (top graph) and Maupin (bottom graph) monitoring stations in 2023 through 8/20/23. The absolute maximum pH standard of 8.5 that applies throughout the Deschutes Basin is depicted by the red lines. At the Warm Springs site, the standard has almost been continuously in violation of the maximum standard since monitoring started in mid-March until August 17, when presumably percent bottom draw from the SWW Tower was increased. At the Maupin station, aside from one day the pH standard has been violated on a daily basis with the natural daily swing that occurs in pH values due to photosynthetic activity in algae and aquatic plants.
Dissolved Oxygen
Daily swings in dissolved oxygen saturation of 15- 20% or greater is not natural for healthy rivers. Large swings and supersaturated dissolved oxygen (well over 100%) are indicative of excess nutrients, which results in excessive algal and aquatic plant growth (EPA 2023b). This, along with elevated pH levels, is consistent with well-documented increases in nuisance algae and stalked diatoms in the lower Deschutes following SWW Tower operations. The DRA believes the available data support our contention that excessive algae, aquatic plant and diatom growth now present in the lower Deschutes is the result of nutrient rich surface spill into the river.
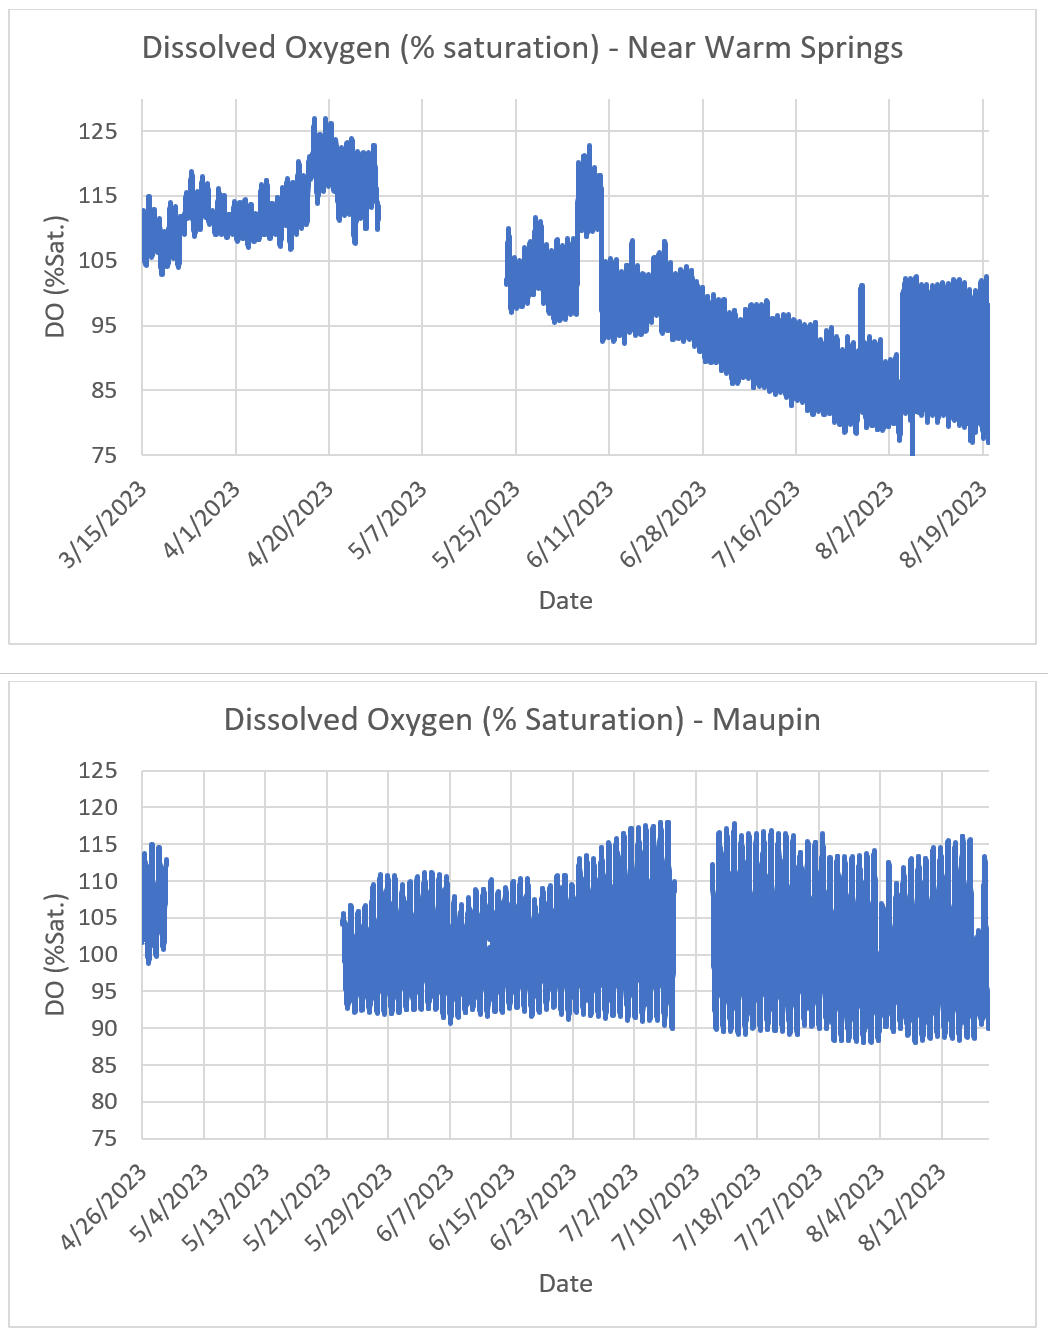
Dissolved oxygen (DO) concentration in percent saturation near Warm Springs (top) and Maupin (bottom) in 2023 through 8/20/23. DO% levels depicted by the blue lines in the two graphs above. The large daily swings in %DO saturation (almost 30% at the Maupin site) are indicative of excessive aquatic plant/algal growth and point to excess nutrients in the river (eutrophication).
Conclusion
In summary, all measures of water quality in the lower Deschutes River have significantly declined since the SWW tower started operating. These are the facts as shown by years of data, collected by us, DEQ, and the Project Operators. Has the SWW tower created natural conditions in any water quality parameter in the lower Deschutes River? You be the judge.
As continuously pointed out in our annual water quality reports, water quality shows immediate improvement with the increase of cool, clean bottom water from the SWW Tower. Further, the available data strongly suggests that this simple operational change would not impact fish passage efforts, decrease power production and we will not run out of cold water, as is often claimed. Conditions cannot be expected to improve in the lower Deschutes unless these operational changes are made.
Sources Cited
Alabaster and Lloyd, 1982. Water Quality Criteria for Freshwater Fish. JS Alabaster, Water Research
Centre, Stevenage, UK, and R Lloyd, Ministry of Agriculture, Fisheries and Food, UK
[PGE] Portland General Electric. 2023. Pelton Round Butte Water Quality Update, 2022 [Video]. YouTube. https://www.youtube.com/watch?v=ffTfslBSfn0
U.S. EPA, 2023a. Causal Analysis/Diagnosis Decision Information System (CADDIS): pH. Office of Research and Development, Washington, DC, 2023. Available at: https://www.epa.gov/caddis-vol2/ph.
U.S. EPA, 2023b. Causal Analysis/Diagnosis Decision Information System (CADDIS): Nutrients. Office of Research and Development, Washington, DC, 2023. Available at: https://www.epa.gov/caddis-vol2/nutrients