Lower Deschutes River Conditions Update - Wednesday 8/23/23
- Data through Sunday 8/20/2023
Key Findings:
As has been observed annually by the DRA, increasing cool, clean bottom water releases from Lake Billy Chinook shows immediate improvements to water quality in the lower Deschutes. Since last Thursday, 8/17, there has been a dramatic drop in both pH (Figure 9) and temperature (Figures 1-2) near the reregulating reservoir dam tailrace at our “Warm Springs” station. pH has been in compliance with the maximum standard of 8.5 at this station since the initial drop. Based on similar occurrences in previous years (see 2022 pH graph below), it’s clear that water quality can be improved by increasing the release of bottom water from the Selective Withdrawal (SWW) Tower in Lake Billy Chinook.
This once again tells us that SWW Tower operations can be changed to bring water quality into compliance with state standards, and thus healthier conditions, in the lower Deschutes River.
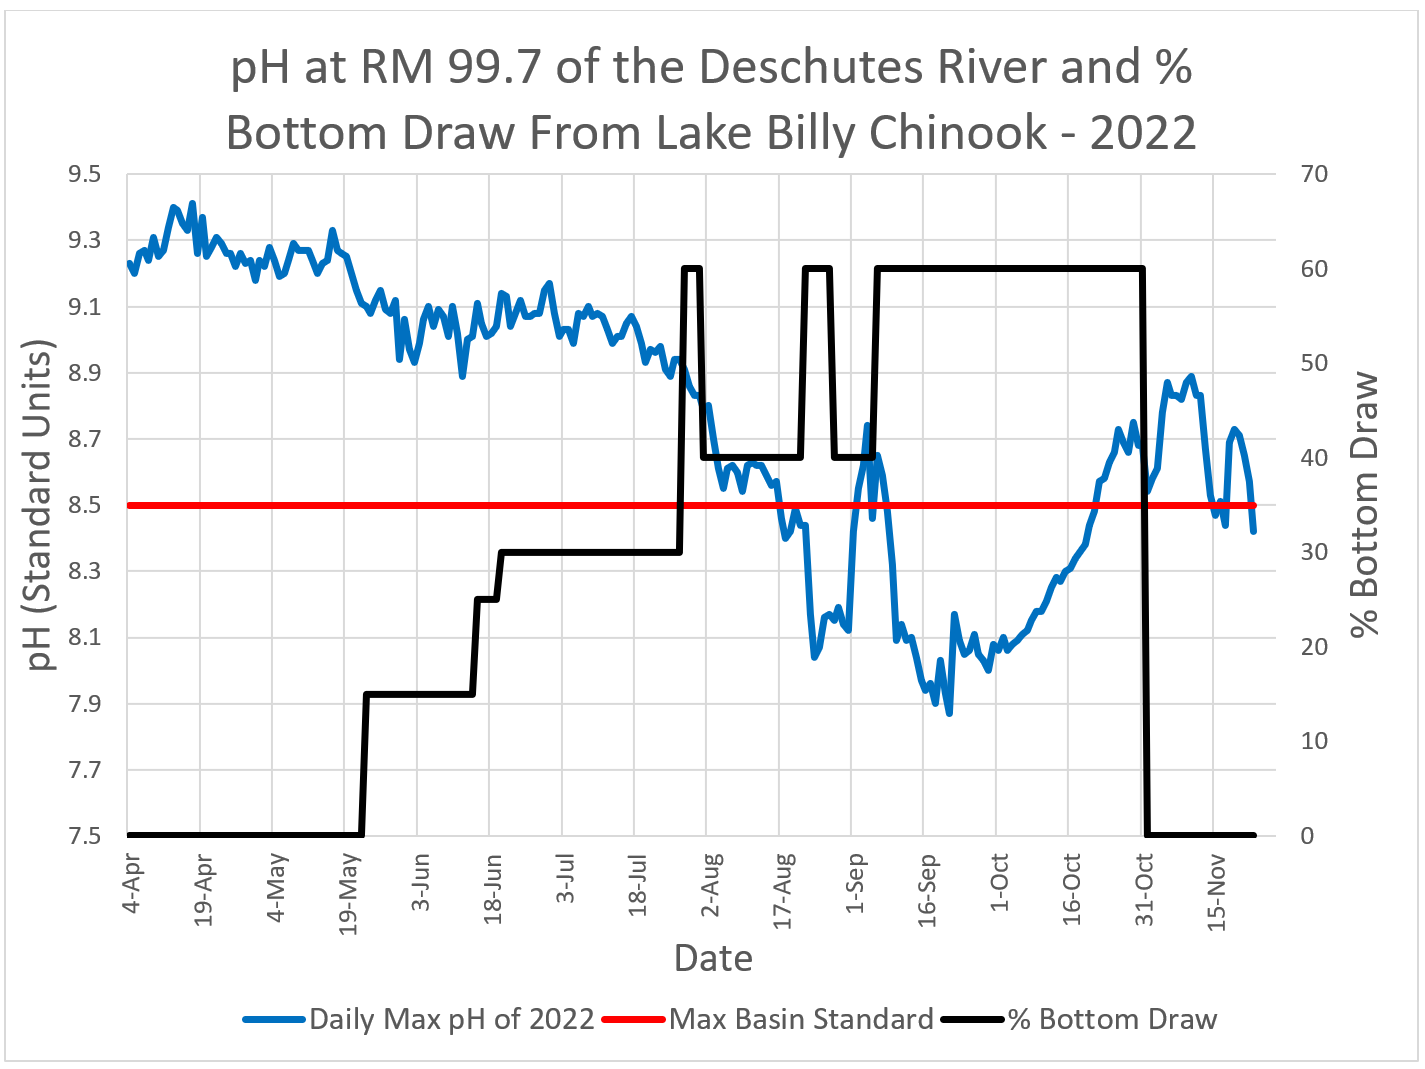
Daily maximum pH collected by the DRA just downstream of PRB complex and % bottom draw from the SWW Tower. Note the three abrupt declines in pH following large increases in bottom draw. % bottom draw data source: retrieved from PGE data reporting to ODEQ in 2022.
Interestingly, while there was a similar dip in pH (Figure 10) and temperature (Figures 3-4) at our monitoring site at Maupin, the dip in pH was not long-lasted given there was a dip in readings on 8/17 but it returned to a daily maximum level of around 9 the following day on 8/18 (Figure 10).
Note that:
- Recent dense wildfire smoke on the lower Deschutes may have also contributed to the lower temperature and pH levels that we are observing - less sunlight leads to less warming of the river and less photosynthesis, and thus lower pH levels. However, the immediate response following more bottom water release shows that the increase in bottom draw from the SWW Tower is the bigger factor.
- There was still a violation of the maximum 8.5 pH standard at the Maupin station on 8/17 since levels were over 8.7 at midnight.
- The telemetry unit is currently down for maintenance at the Maupin site (water quality data is still being collected).
Aside from the recent exceptions noted above, there have been daily violations of the pH standard in the lower Deschutes for the duration of our monitoring in 2023, which has unfortunately been a common occurrence since the DRA started continuous water quality monitoring in the lower Deschutes back in 2016.
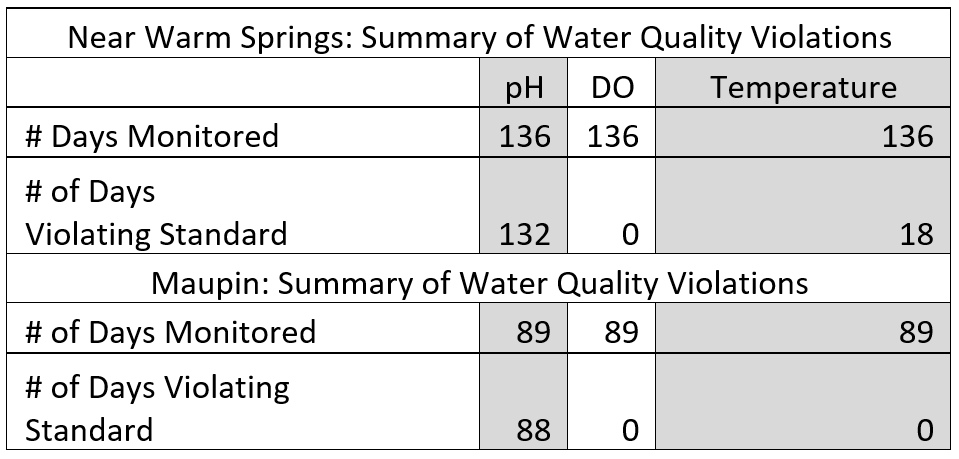
Directly below is a summary table of pH, dissolved oxygen (DO) and temperature at our two monitoring stations to date for the 2023 monitoring season:
Background
The relative increase in water quality standard (particularly pH and temperature) violations are representative of the negative shifts that have been observed in the lower Deschutes River following SWW Tower operations in 2009, including the increased abundance of nuisance algae, decline in sensitive aquatic insect abundance and shift in emergence, and increased prevalence of fish disease and parasites.
Summary:
This document will be updated ~1-2 weeks to report on the current conditions in the lower Deschutes River. It includes water quality conditions at each of our two monitoring sites near Warm Springs and Maupin, weekly flow snapshots from the USGS Madras and Moody gauges, and an update on the latest aquatic insect hatches occurring throughout the river based on entries we receive from the public on our Aquatic Insect Hatch App. Please consider keeping your fellow anglers informed by making entries to our hatch app while you are on the lower river!
Outline:
The following data will be provided in this weekly update:
- Water quality update:
- Tables 1-2 provides an overview of the water quality violations for pH, temperature, and dissolved oxygen (DO) observed by the DRA in the lower Deschutes River at our two monitoring stations so far during the 2023 monitoring season.
- Figures 1 – 10 depict current graphs of temperature, dissolved oxygen (DO) and pH at our two monitoring stations during the 2023 monitoring season. Data gaps were periods where (1) flow levels are too high to safely have equipment deployed or (2) technical difficulties with the water quality meters or transponder equipment – i.e. battery levels.
- Flow update: Figures 11 -12 depict the last thirty days of flow data from the USGS Madras (near Warm Springs) and Moody (near the mouth) gauges in the lower Deschutes
- Aquatic insect hatch data: Table 3 summarizes the most recent hatches occurring on the lower Deschutes based on entries received from our aquatic insect hatch app
Public Portal:
You can view the current water quality conditions at each of our two monitoring sites on our Public Portal. Conditions are updated every 10 minutes.
Note that our Maupin telemetry unit is currently down for maintenance. Last available data point on the public portal is from Aug 19, but rest assured that the water quality meter is still collecting data. Live readings will be restored ASAP.
For Additional information:
Our Public Portal Help Sheet contains the following:
- How to use the Public Portal
- Additional background information
- What the aquatic life use designations mean
- What the water quality standards are in the lower Deschutes and why they are important
For more information on how the river ecosystem has changed in the lower Deschutes following SWW Tower operations as a result to declining water quality, please read our annual 2022 Lower Deschutes River Water Quality Report, or watch our recent State of the Lower Deschutes webinar.
Water Quality Update
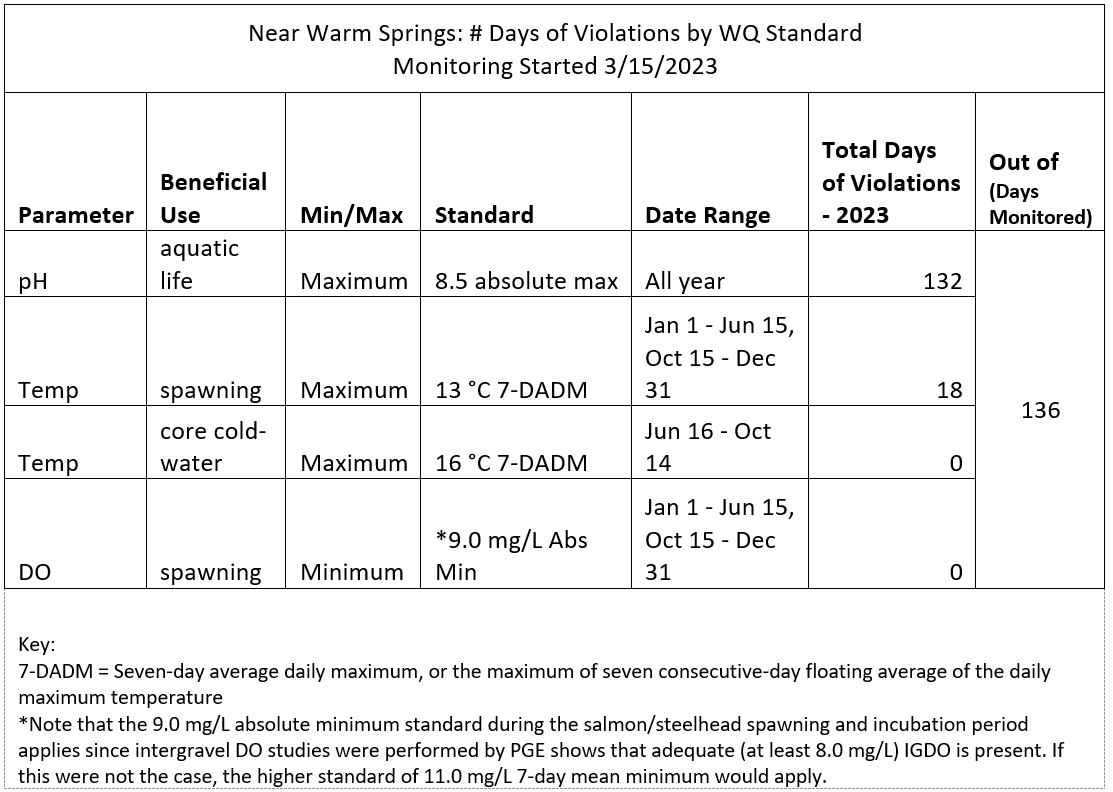
Table 1. Running tally of water quality standard violations in the lower Deschutes River recorded Aby DRA water quality sondes at the Warm Springs station. Tally organized by parameter, and the various standards that apply in the lower Deschutes for each parameter.
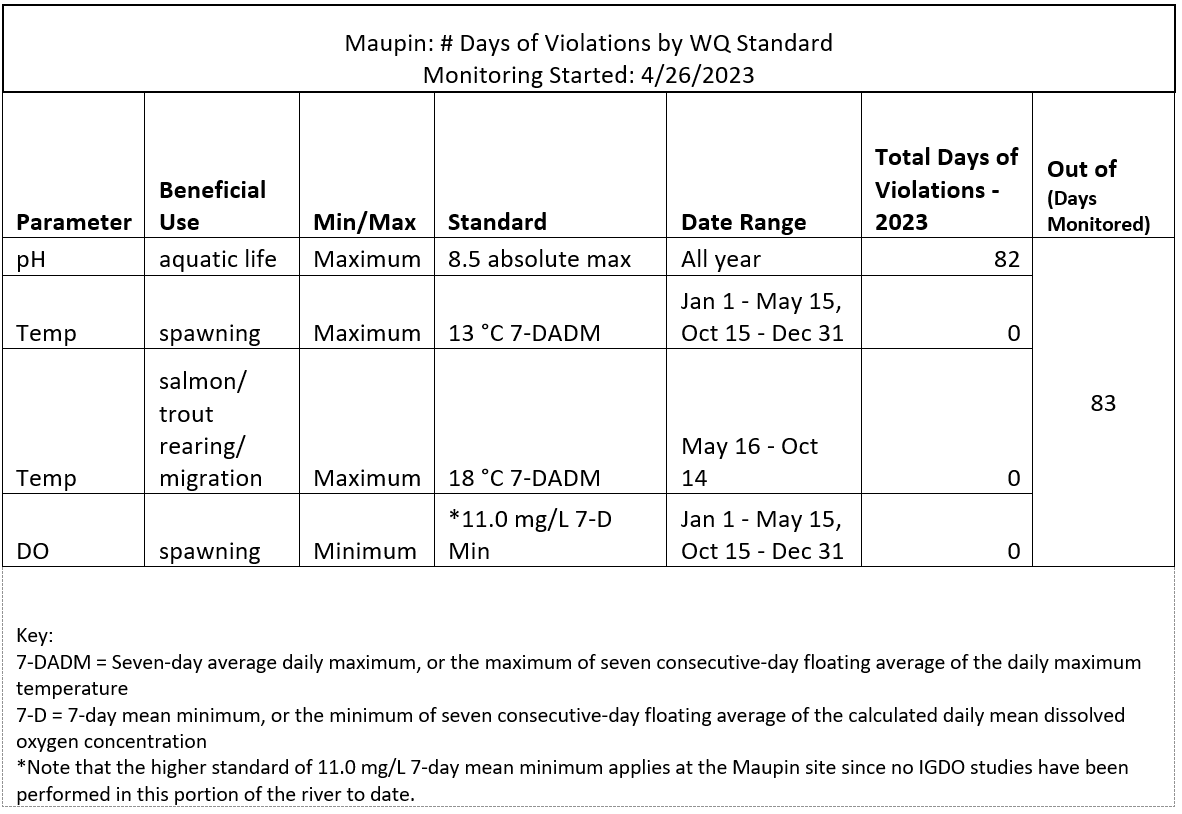
Table 2. Running tally of water quality standard violations in the lower Deschutes River recorded by DRA water quality sondes at the Maupin station. Tally organized by parameter, and the various standards that apply in the lower Deschutes for each parameter.
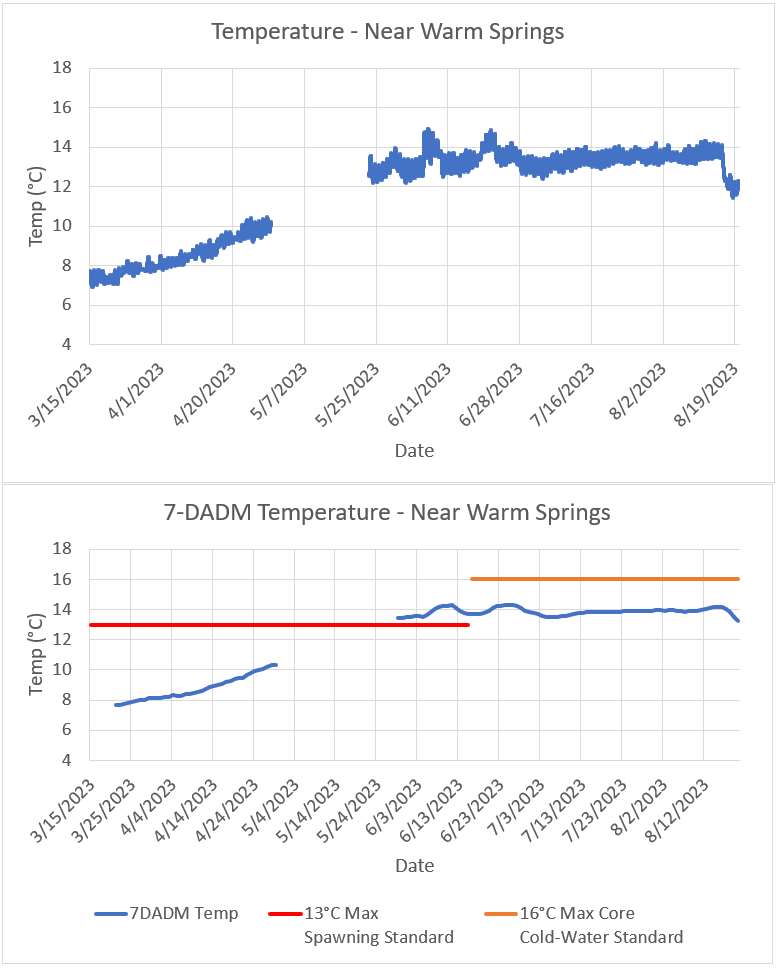
Figures 1 – 2. Instantaneous temperature (top) and rolling 7-day average daily maximum (7-DADM) temperature (bottom) at the Warm Springs site depicted by the blue lines in the two graphs above. The rolling 7-DADM temperature is what is applied for the temperature standards throughout Oregon. Red line in bottom graph depicts the maximum 13 °C standard that applies during the designated salmon/steelhead spawning period of October 15 – June 15 at this site. Orange line depicts the maximum 16 °C core cold-water standard that applies June 16 – October 14 at this site. Note the violation of the temperature standard at the Warm Springs site from 5/30/23 to 6/15/23.
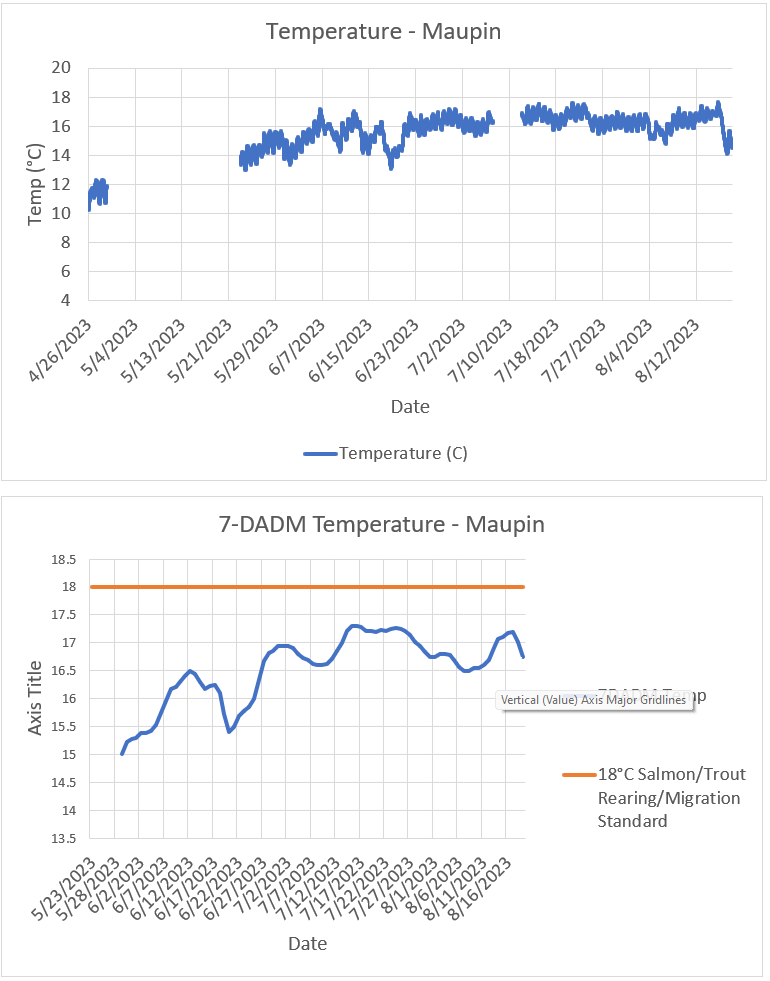
Figures 3 -4. Instantaneous temperature (top) and rolling 7-day average daily maximum (7-DADM) temperature (bottom) at the Maupin site depicted by the blue lines in the two graphs above. The rolling 7-DADM temperature is what is applied for the temperature standards throughout Oregon. Orange line depicts the maximum 18 °C salmon/trout rearing and migration standard that applies May 16 – October 14 at this site. The salmon/steelhead spawning period is designated October 15 – May 15 at this site. The first 7-DADM data point did not occur until May 29, which why the spawning standard is not included in the bottom graph.
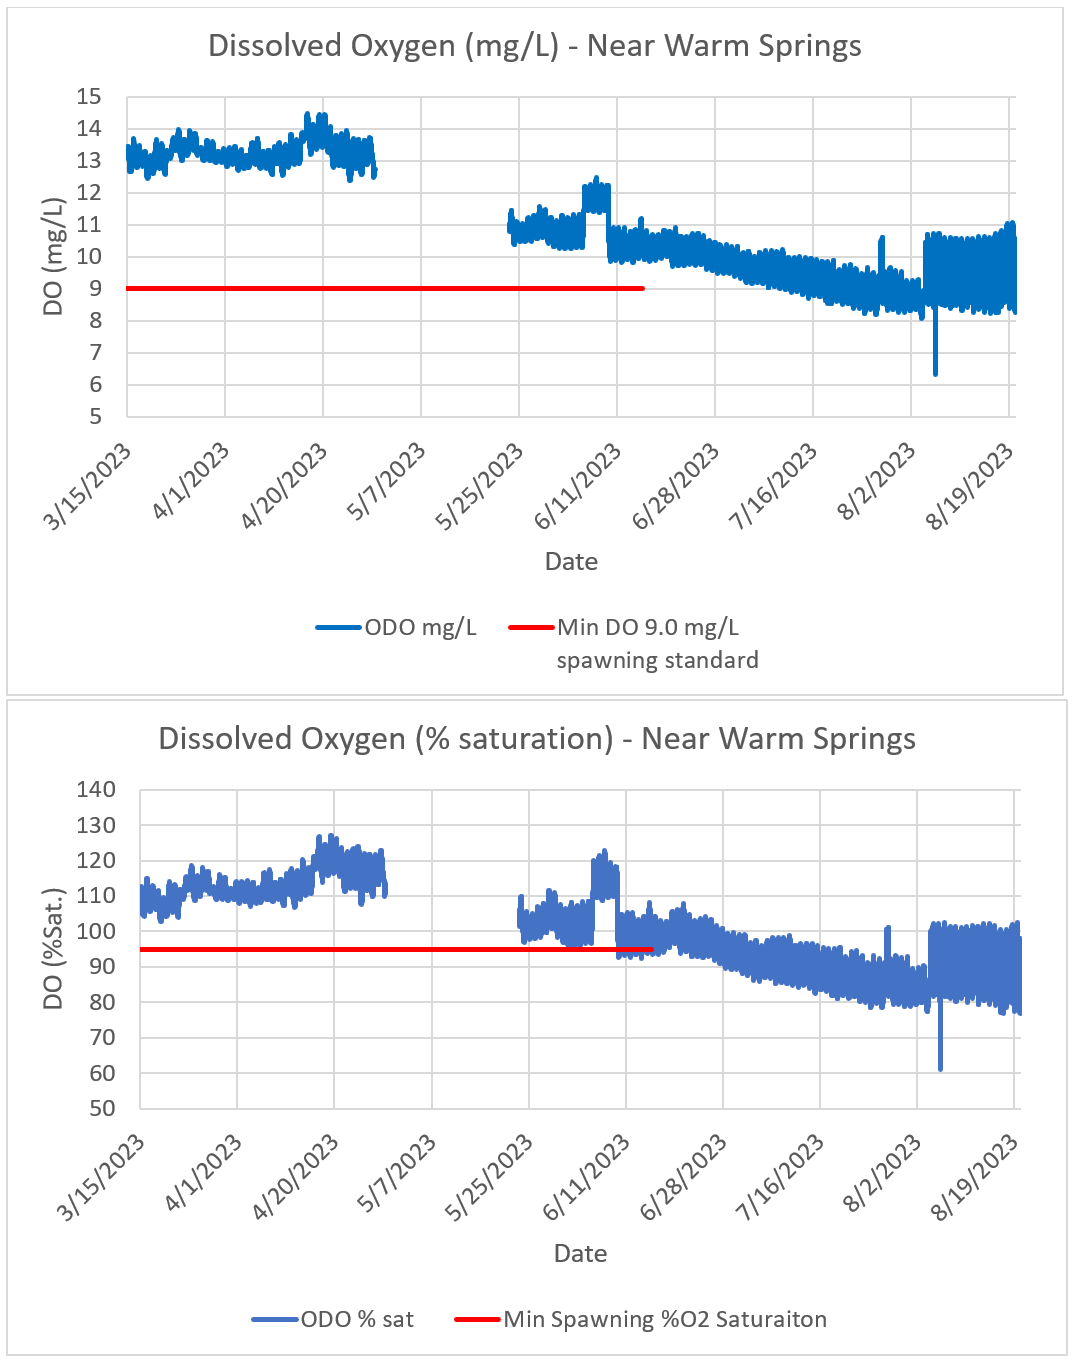
Figures 5-6. Dissolved oxygen concentration near Warm Springs in mg/L (top) and percent saturation (bottom) depicted by blue lines in the two graphs above. The absolute minimum 9.0 mg/L and 95% saturation dissolved oxygen standard that applies during the salmon/steelhead spawning period of October 15- June 15 at this site are depicted by the red lines. Note that the percent saturation standard only applies if conditions of barometric pressure, altitude, and temperature preclude achievement of the 9.0 mg/L standard. The large daily swings in %DO saturation (about 25% ) are indicative of excessive aquatic plant/algal growth and point to excess nutrients in the river (eutrophication).
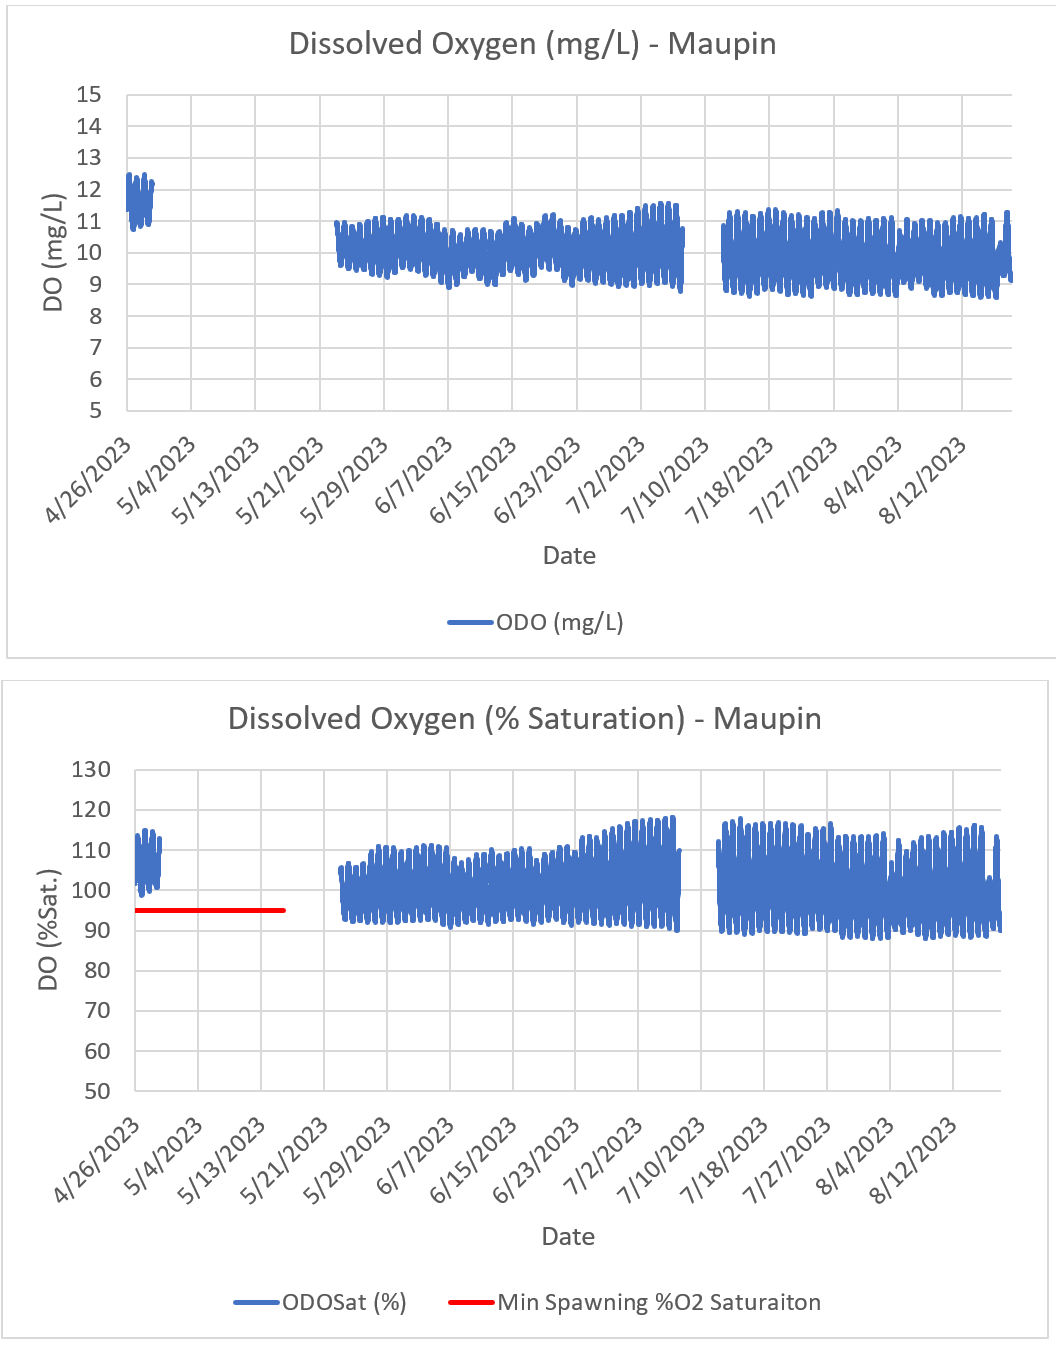
Figures 7-8. Dissolved oxygen concentration at Maupin in mg/L (top) and percent saturation (bottom) depicted by blue lines in the two graphs above. The absolute minimum 95% saturation dissolved oxygen standard that applies during the salmon/steelhead spawning period of October 15- May 15 at this site is depicted by the red line in the bottom graph. Note that the percent saturation standard only applies if conditions of barometric pressure, altitude, and temperature preclude achievement of the 9.0 mg/L standard. Also note that there was not enough data collected at the Maupin site during the spawning season (3 days, 7 days needed) to calculate the 7 day mean minimum DO in mg/L, which is 11.0 mg/L at this site during the designated spawning/incubation period. The large daily swings in %DO saturation (almost 30%) are indicative of excessive aquatic plant/algal growth and point to excess nutrients in the river (eutrophication).
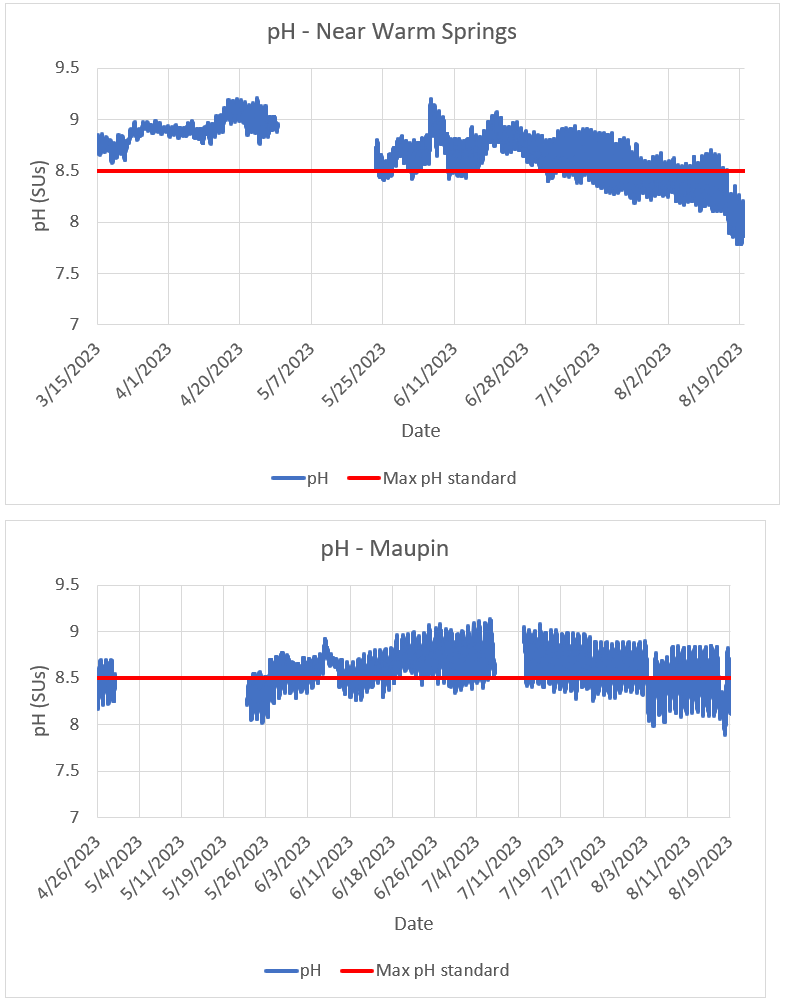
Figures 9-10. pH readings near Warm Springs (top) and Maupin (bottom) depicted by the blue lines in the two graphs above. The absolute maximum pH standard of 8.5 that applies throughout the Deschutes Basin is depicted by the red lines. At the Warm Springs site, the standard has almost been continuously in violation of the maximum standard since monitoring started in mid-March until August 17, when presumably percent bottom draw from the SWW Tower was increased. At the Maupin station, aside from one day the pH standard has been violated on a daily basis with the natural daily swing that occurs in pH values due to photosynthetic activity in algae and aquatic plants.
Flow update:
Higher than average (over the last two decades) snowpack caused peak spring flows to be the highest since 2019 at 6800 cubic feet per second (cfs) just downstream of the Pelton-Round Butte (PRB) dam complex and 10,600 cfs near the mouth of the lower Deschutes on May 1, 2023. Unsurprisingly, due ongoing drought, flows have reduced to about 3600 cfs just downstream of the PRB complex and 4100cfs near the mouth, which is lower than the median for the period of record.
Screenshots from the last 30 days discharge data in cubic feet per second (cfs) from the USGS Madras Gauge (just downstream of the Pelton-Round Butte complex) and Moody Gauge (near the mouth of the lower Deschutes) are shown in Figures 11 – 12 below.
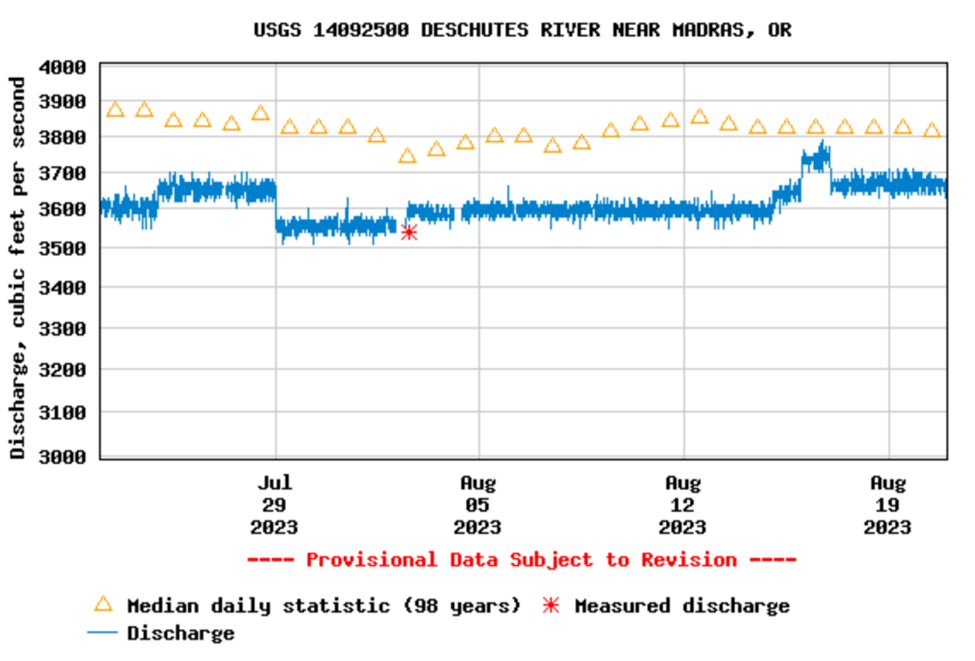
Figure 11. Graph depicting discharge (cfs) at the USGS Madras gauge from July 23 to Aug 20.
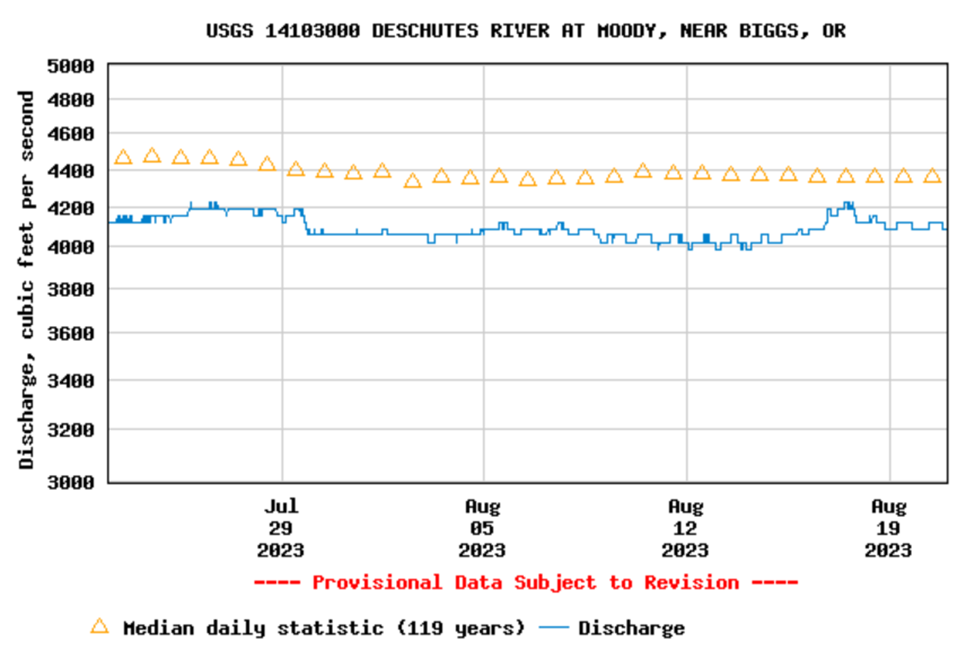
Figure 12. Graph depicting discharge (cfs) at the USGS Moody gauge from July 23 to Aug 20.
Current hatches on the lower Deschutes:
Since 2013, DRA has collected macroinvertebrate hatch data to help track shifts in timing and abundance. The last entry into our lower Deschutes Hatch App was on 7/26/2023.
Entries from the month of July summarized in Table 3 below indicate that at the time of entry caddis flies were the primary hatch occurring on the lower Deschutes from Warm Springs to Sandy Beach. As of the last entry, net-spinning caddis (Hydropsyche sp. see Figure 13) were reported at a “high” (level 3 of 3) abundance in the Warm Springs to Trout Creek reach and “moderate” (level 2 of 3) from the Harpham to Sandy Beach reach. Micro caddis (Figure 14, family Hydroptilidae) were reported at “low” (level 1 of 3) abundance from Harpham to Sandy Beach. Craneflies (Antocha sp., Figure 15) and aquatic moths (Petrophila sp. Figure 16) were also reported at a “low” abundance in the Harpham to Sandy Beach reach.
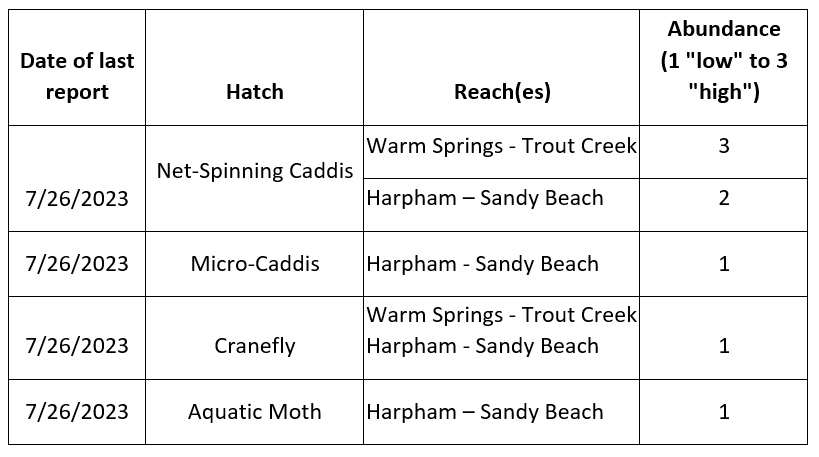
Table 3. Summarized entries from the DRA’s lower Deschutes hatch app from the month of June.
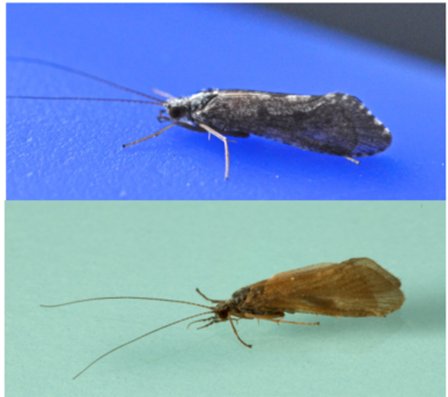
Figure 13. Net-spinning caddis adults. Photo credit: Rick Hafele
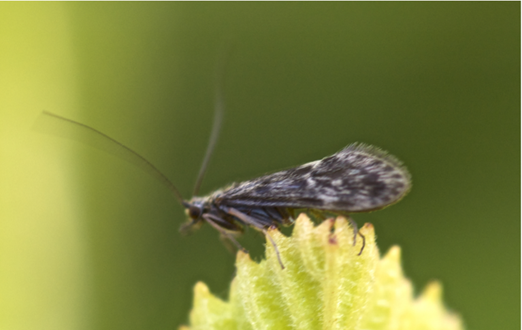
Figure 14. Micro caddis adult. Photo credit: Rick Hafele
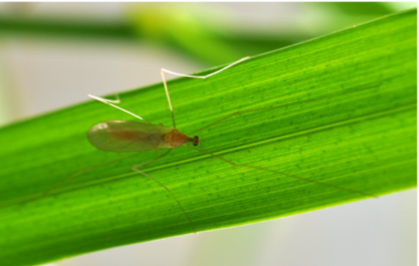
Figure 15. Cranefly adult. Photo credit: Rick Hafele
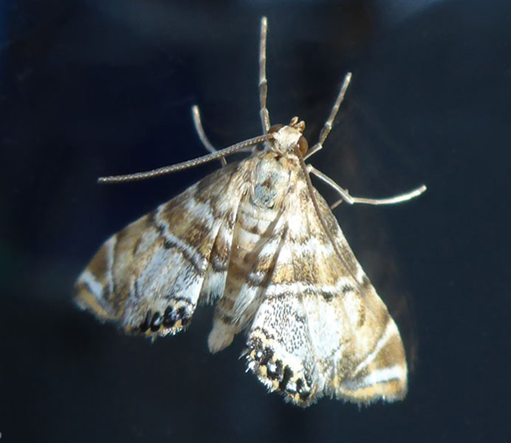
Figure 16. Aquatic moth adult. Photo credit: Mark Bachmann
We highly encourage you to fill out this survey each time you are out on the lower Deschutes to keep your fellow anglers informed, and provide the DRA with invaluable data. For more information, please see our hatch app webpage. Prior to filling out your first survey, we ask that you watch the following identification training video.