Temperature Standard Violations are Representative of the Mismanagement of the SWW Tower
Temperature standard violations from the available data tells the story of management (and mismanagement) of water quality in the lower Deschutes Basin. According to the § 401 Certification Conditions of the Project (Pelton-Round Butte 3-dam complex), one of the primary goals of the Selective Withdrawal (SWW) Tower in addition to attempting to establish anadromous fish passage was too “…reduce the Project’s contribution to exceedances of water quality standard criteria for temperature.” Unfortunately, violations of the temperature standards set in the lower Deschutes to protect aquatic life (principally spawning and egg incubation of salmonids) have increased following Selective Withdrawal (SWW) Tower operations at the outlet of Lake Billy Chinook.
As we have frequently pointed out, this is representative of the overall warming trend of the lower Deschutes post-Tower. This, along with excess nutrients now released from the surface of the Lake Billy Chinook directly into the lower Deschutes has contributed to the well-documented negative ecological shifts that have occurred following Tower operations. These include declines in sensitive aquatic insects, increases in nuisance algae, seasonally abundant smallmouth bass, and increases in worms and snails that are intermediate hosts for several fish diseases. These all show how Tower operations have caused overall harm to the Deschutes ecosystem.
The bar graph below shows that violations of the lower Deschutes temperature standards did occur prior to Tower operations, but were infrequent with only 0-5 days annually after the Pelton-Round Butte dam complex (Project) was completed. However, the number of days in violation of temperature standards increased substantially following Tower operations: 2-36 days annually. It should be noted that the relative proportion of temperature standard violations (as they apply today) following Tower operations is similar to temperature violations during the period prior to the construction of the Project. This will be covered in detail below, but helps explain some of the current mismanagement of the Project.
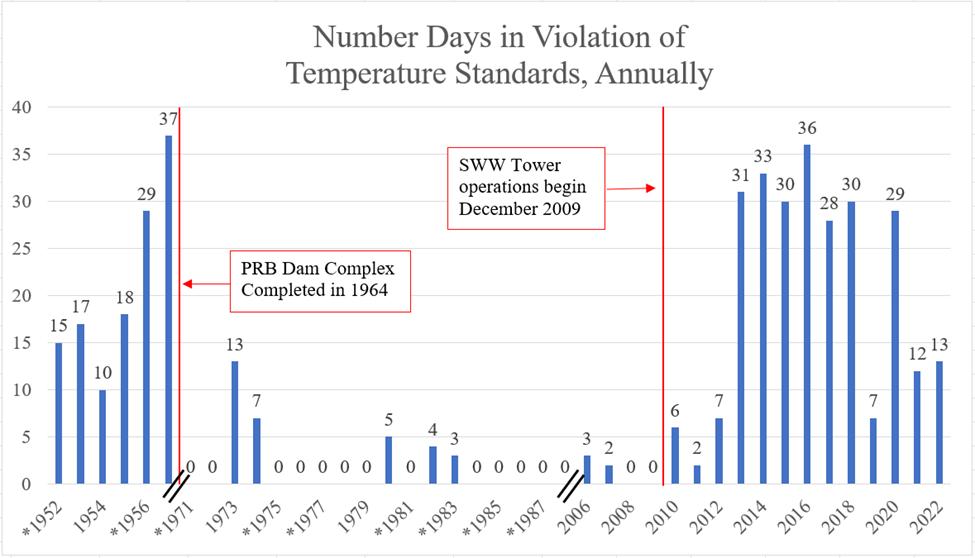
Bar graph depicting the number of days in violation of the applicable temperature standards (as of 2023) in the lower Deschutes, by year, for the available data record at the USGS Madras Gage – 14092500: 1952-1958, 1971-19 88, 2006-2022. Red lines depict distinct changes in the way water was released into the lower Deschutes. Parallel black lines on the horizontal axis depict data gaps between the 1950s to 1970s and the 1980s to 2000s.
*Note that during some years 1952 -1988 (denoted by an asterisk), some days of temperature data are missing. The missing data is not believed to skew overall temperature trend changes over time.
Water quality standards were set in place by state governments following the enactment of the Clean Water Act (CWA) in 1972. Current temperature standards in the lower Deschutes River were set by Oregon Department of Environmental Quality (ODEQ) to protect aquatic organisms that are most sensitive to temperature. In the case of the Deschutes, this is salmonids, whose most sensitive life history stage is spawning and egg incubation. Spawning/incubation periods, which have stricter (cooler) temperature standards, currently run from October 15 to May 15 or June 15, depending on location in the lower Deschutes. Less strict standards are set from May 16/June 16 to October 14 for the non-spawning period. For more information regarding temperature standards and how they apply in the lower Deschutes, please reference the following document and/or ODEQ’s water quality standard webpage.
Even though the current water quality standards, including temperature, did not apply in the 1950s, it is still informative to analyze the available temperature data from this time period before the dams were completed in 1964. This period was prior to the signing of the CWA in 1972. Because it was also a period well after the start of largely unregulated Western development and agriculture in Central Oregon, this pre-Project period represents a time when (1) anthropogenic impacts on the upper watershed and water quality were high and (2) no mitigation measures to ameliorate those impacts were in place (Barrett 2017). While other water quality data are not available during the 1950s (ie: pH), the high number of temperature standard violations, as they apply today, make it clear that water quality was certainly poor during this period.
Ironically, this temperature data from the 1950s is the reference data the Project Operators used to develop the temperature model (Huntington 1999) that has been used since the beginning of Tower operations. This model includes a regression equation that calculates target temperatures during spring through fall to mimic what maximum river temperatures would be like in the Deschutes River directly downstream of the Project if the Project were not present. These temperatures are what the Project Operators call the “natural” or pre-dam water temperature conditions. The DRA contends that this current temperature model is based on data from a period of poor stream conditions. Project managers should, rather than use a model to manage water for so-called “natural” conditions, manage the Tower for the best water quality possible.
Portland General Electric and the Confederated Tribes of the Warm Springs Reservation of Oregon convened the “Lower Deschutes River Pilot Stakeholder Working Group” which concluded meeting earlier this year. The original purpose of the working group was to brainstorm ways to cool temperatures in the lower river. The DRA attended all group meetings and was one of the few voices among stakeholders, and the only NGO, directly advocating for the immediate relief to the lower Deschutes that more bottom draw from the SWW Tower would provide. The group’s three proposed actions, while well intentioned, will all fail to cool the lower Deschutes River.
As described in our recent temperature, pH, and nutrients posts, both temperature and pH show immediate improvement with an increase in bottom draw. The DRA will continue to be the voice of the lower Deschutes and diligently push DEQ to enforce its own water quality standards and push dam Operators to use actual adaptive management to the benefit of downstream water quality as required by their license.
Sources Cited
Barret, K. 2017. Agriculture and Irrigation in Oregon’s Deschutes and Jefferson Counties. Bozeman, MT: Headwaters Economics, Available: https://headwaterseconomics.org/wp-content/uploads/Deschutes_River_Basin_Agricultural_Report.pdf
Huntington, C., Hardin, T., Raymond, R. 1999. Water Temperatures in the Lower Deschutes River, Oregon. Portland, OR: Portland General Electric.